
WELCOME TO THE CU GRACE MISSION
REAL-TIME DATA ANALYSIS PORTAL
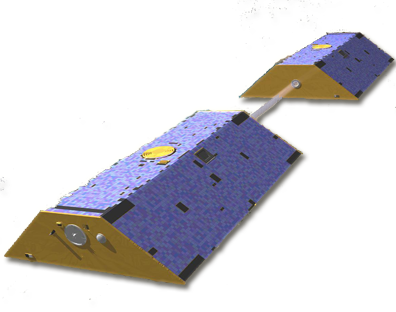
This website allows visitors to perform basic data analysis on publicly
available Level-2 GRACE data. Computations are performed in real-time,
producing downloadable maps or time series.