


How to Use the Data Portal
Please read the information below to get started generating GRACE maps and time series.
For more information, please consult the Documentation.
Navigating the Map View
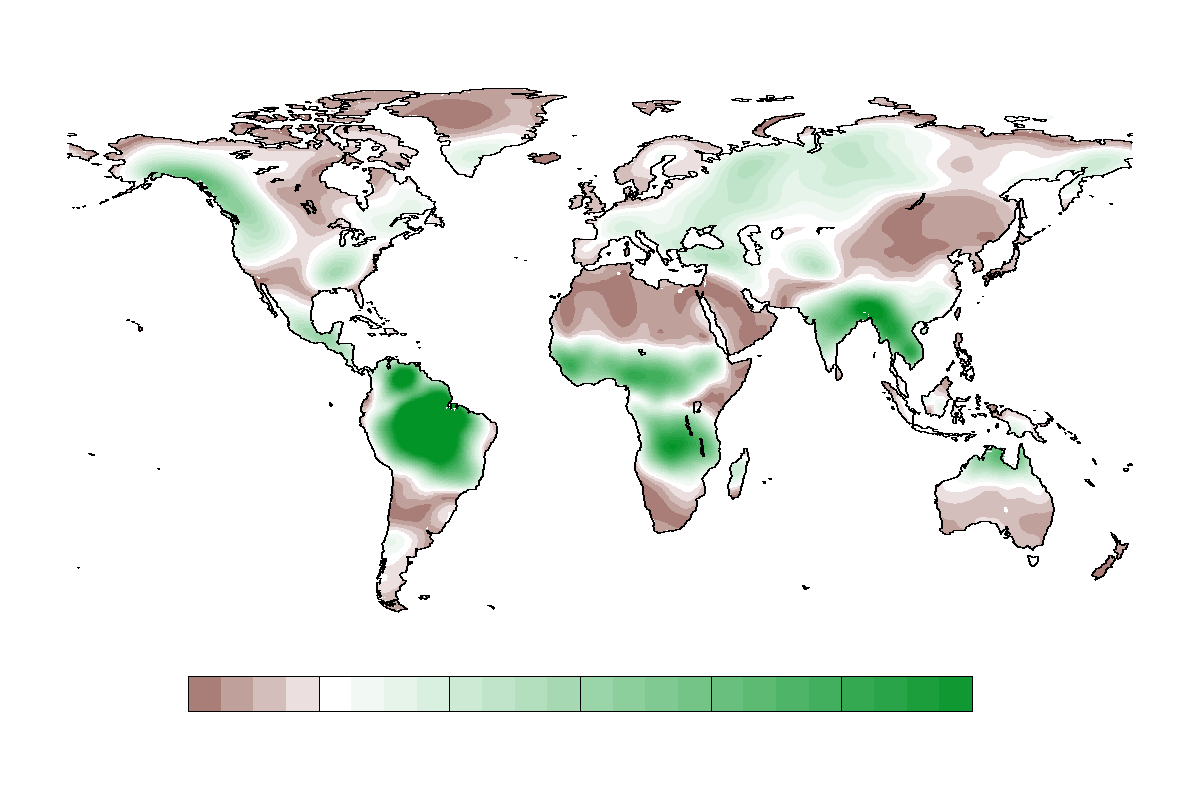
Plot Type
Maps can be produced for the following quantities: Annual Amplitude, Annual Phase, RMS (Temporal), RMS about the Annual Cycle, Trend, and Monthly Anomaly (with respect to static field).
Data Center
Data from three institutions are currently made available using GRACE Release 05 Level 2 data: Center for Space Research (CSR), German Research Centre for Geosciences (GFZ), and the Jet Propulsion Laboratory (JPL).
Latitude / Longitude
A sub-region of the map can be chosen by selecting the Zoom Tool at the upper left of the Map View tab. Clicking once selects the first corner of a rectangular selection window, and clicking a second time selects the opposite corner. The Reset Extent button will return the values to their global values and the Return button will return the map to its previous extent.
Scale
The scale of the plot can be adjusted by using the Scale slider.
Smoothing Radius
The radius (half-width, half-maximum) of the Gaussian filter used to smooth the GRACE data can be specified using the Smoothing Radius slider.
Map Annotations
Maps can be overlain with various geographic information. The "Local Projection" button changes the map projection and is most useful at high latitudes.
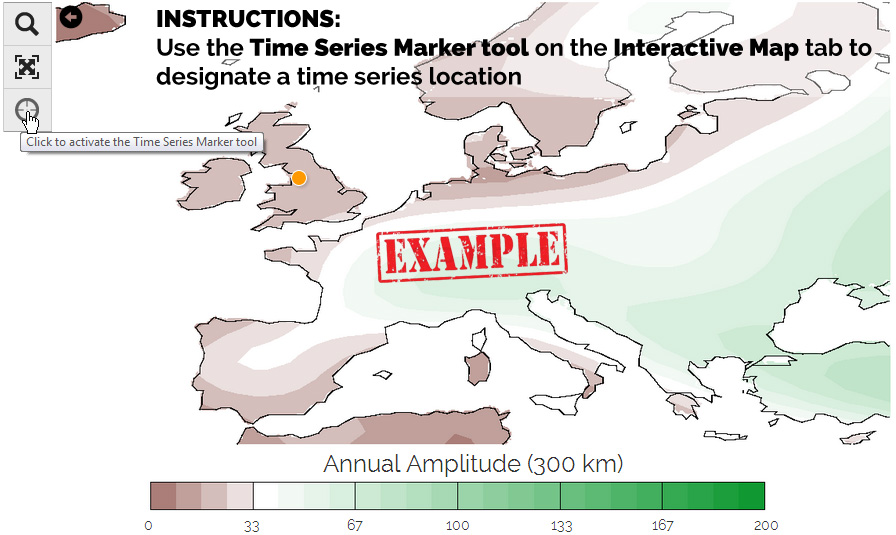
Creating Time Series
After selecting the Time Series Marker Tool at the upper left of the Interactive Map tab, click on the current map to place an orange dot. This dot signifies the location for which to produce a time series plot. After placing the orange dot, select the Time Series tab to view the time series. The shape of the averaging region can be changed by using the Region Type pull-down menu. Averaging regions can be river basins from four different basin boundary datasets, or a disc of specified radius centered on the selected point. The four river basin datasets are the TRIP (Total Runoff Integrating Pathways) dataset and three datasets derived from the USGS HYDRO1K dataset. The latter use the Pfafstetter convention to denote basins of progressively smaller areas.
Scaling
As described in Landerer and Swenson, 2012, the filtering used to reduce errors in the GRACE data can lead to signal modification (e.g. attenuation). This effect can in part be reduced by applying gain factors to the filtered data. Gain factors used to scale the GRACE time series are estimated by applying the filters to models of total water storage. The colored boxes in the legend of the time series plot may be toggled to select various time series.
Error Bars
Uncertainty due to errors in the GRACE data based on the method described in Wahr et al. [2004] GRL paper can be overlain on the GRACE time series.